![]() ISSN: 1885-8031
ISSN: 1885-8031
https://dx.doi.org/10.5209/REVE.85557
Análisis de los Tweets de los minoristas de alimentación que operan en España y UK. Cómo el análisis del contenido generado por los usuarios en Twitter puede ayudar a las cooperativas agroalimentarias a establecer mejores relaciones con sus clientes
Juan Diego Borrero Sánchez[1]![]()
Recibido: 27 de agosto de 2021 / Aceptado: 8 de septiembre de 2022 / Publicado: 12 de abril de 2023
Resumen. Twitter es una destacada plataforma de medios sociales utilizada ampliamente por las empresas alimentarias para compartir información con los consumidores. Este estudio tiene como objetivo determinar el comportamiento en Twitter de diferentes minoristas de alimentación que operan en España y el Reino Unido para arrojar luz sobre sus intereses y afinidades. El estudio recopiló y analizó un total de 54.000 tweets de las cuentas oficiales de Twitter de 17 minoristas de alimentación. Analizando el contenido generado por los minoristas de alimentación en Twitter con el recuento de palabras, el análisis de contenido generado por estos usuarios y el análisis de redes sociales, se detectaron algunas características que podrían ser relevantes para los proveedores de estos minoristas de alimentación. La identificación de las diferencias en la actividad y las comunicaciones en Twitter, así como también las afinidades entre algunos de ellos, confirman el potencial de los datos de Twitter como fuente de información para realizar estudios de marketing en general. Del mismo modo, descubrimos que la adopción de la analítica de datos de Twitter por los responsables de marketing de las cooperativas agroalimentarias podría ser muy útil para avanzar en las estrategias centradas en el cliente. Finalmente, la investigación presenta las limitaciones y propone nuevas líneas de trabajo futuro.
Palabras clave: Análisis de redes sociales; Minería de texto; Análisis de Contenido; Agricultura digital; Big data.
Claves Econlit: D82; D85; Q13.
[en] Analysis of tweets from food retailers operating in Spain and the UK: How user-generated content on Twitter can help agrifood cooperatives build better relationships with their customers
Abstract. Twitter is an outstanding social media platform that food firms are using to share information with consumers. This research aims to determine the behavior of different food retailers in Spain and the UK in relation to Twitter to shed light on their interests and similarities. This study collected and analyzed a total of 54,000 tweets from 17 food retailers from the social media platform Twitter. Analyzing food retailers’ generated content on Twitter by wordcount, content analysis and social network analysis, several characteristics were detected that could be relevant for suppliers of these food retailers. The output reveals differences among food retailers as well as groups with different strategies within each market and confirms the potential of Twitter data as an information source for conducting marketing studies. Similarly, we found that the adoption of Twitter data analytics by marketing managers of agrifood cooperatives could be very useful for advancing customer-centric strategies. Finally, this research presents its limitations and proposes new lines of future work.
Keywords: Social network analysis; Text mining; Content analysis; Digital Agriculture; Big data.
Summary. 1. Introduction. 2. Literature Review. 3. Materials and Methodology. 4. Results. 5. Discussion. 6. Conclusions. 7. References.
How to cite. Borrero, J.D. (2023). Analysis of tweets from food retailers operating in Spain and the UK: How user-generated content on Twitter can help agrifood cooperatives build better relationships with their customers. REVESCO. Revista de Estudios Cooperativos, 1(143), e85557. https://dx.doi.org/10.5209/reve.85557.
1. Introduction
Spain is the largest producer of fruit and vegetables in the European Union, and the United Kingdom (UK) is one of the largest consumers of fresh food, with Spain being their main supplier (Messe Berlin GmbH, 2021). In this context, the agrifood producer sector is the weakest link in the fresh food value chain, as it depends on food retailers (Cucagna and Goldsmith, 2018); hence, understanding retailers’ interests could be vital in gaining a competitive advantage.
Accordingly, retailer communication with their consumers through digital social media technology can reflect these interests well and, thus, serve as a basis for determining the production and marketing strategies of agrifood cooperatives.
Thus, the evolution of technology, especially mobile devices, is allowing people to access information in an easier, faster, and more immediate way, promoting the growth of online social networks (Kaplan and Haenlein, 2010; Pew Research Center, 2019). In recent years, the ten most popular social media networks worldwide were used by 13,947 million users (Statista, 2022), providing a rich source of data that can be employed to support decision making (Dwivedi et al., 2020; Zachlod et al., 2022).
Social media is used by more than 90% of young adults (Fleming-Milici and Harris, 2020), transforming the way people interact (Jacobsen et al., 2021). Social networking sites (SNSs), as direct communication channels with users, can help the agrifood sector achieve positive outcomes for producers (Recuero-Virto and Valilla-Arróspide, 2022) and could also be an excellent channel for disseminating information and building trust (Buskens, 2020). Food companies, such as food retailers, use this technology to improve their relationship with consumers (Jacobsen et al., 2021; Recuero-Virto and Valilla-Arróspide, 2022).
Of all the SNSs, Twitter (San Francisco, CA) is one of the most used, with approximately 500 million tweets posted every day by 436 million active users (Statista, 2022), which makes it a great platform for public communication (Araújo Britto Sass et al., 2020; Sashittal and Jassawalla, 2019; Zanini et al., 2019) and essential in achieving users’ interests (Samoggia, Riedel and Ruggeri, 2020). Therefore, Twitter offers great utility to agrifood companies through informing and listening to consumers (Liu, Burns and Hou, 2017).
Creating a high-quality customer experience is key to retailer success (Grewal, Ley and Kumar, 2009; Grewal and Roggeveen, 2020), as it is seen as a predictor of consumer behavior (Imhof and Klaus, 2020). If SNSs can be leveraged to enhance customer experience (Roggeveen and Grewal, 2016), user-generated content (UGC) can be extracted and analyzed to infer insights into customers’ experience (Sivarajah et al., 2017).
Although the area with the greatest interest in using information from social networks is marketing (Ducange et al., 2019; Nobre and Silva, 2014; Taueja and Toom, 2014), we found insufficient research regarding the usefulness of social media data for the agrifood cooperative sector.
This paper contributes to filling this gap by assessing the utility of tweet analysis for agrifood cooperatives. Thus, we proposed the following research questions (RQs) related to the main food retailer accounts operating in Spain and the UK.
RQ1. How do food retailers communicate on Twitter? The purpose was to analyze the activity of their official accounts on Twitter.
RQ2. Is it possible to identify different topics examining user-generated content on Twitter? The aim of this question was to identify differences between both markets.
RQ3. Are there differences among retailers? Social network visualization was employed to identify hidden links among retailers.
The rest of the paper is structured as follows: Section 2 reviews recent research on the use of social media, in general, and Twitter, in particular, related to agrifood. Section 3 is the methodology, which describes the sample, data extraction and data analysis processes. Then, the results are presented and discussed in Section 4. Finally, Section 5 presents the conclusions, their implications, new lines of research and limitations.
2. Literature Review
Due to the growth of SNSs, users have also been changing their consumption and shopping habits (Elghannam et al., 2020). Thus, Andrews and Currim (2004) compared the behavior of typical customers, who make traditional purchases, with those who buy online, while trying to identify the reasons for these decisions. Degeratu, Rangaswamy and Wu (2000) examined how this increased availability of information to consumers via the Internet affects the image of supermarkets, predicting the consequences that opinions on social networks can have for different supermarkets.
In relation to the way users interact on social networks, Smith, Fischer and Yongjian (2012) analyzed the use of YouTube, Facebook and Twitter, noting that Twitter is more oriented to the exposure of daily life than the others.
Among all existing social media platforms, Twitter is the most used by companies (78%), followed by LinkedIn (74%) and Facebook (44%) (Go and You 2016). The reason for this, among others, is that taking care of consumers and covering their needs are key points in any marketing plan, which these online platforms achieve in a more personalized and efficient way (Recuero-Virto and Valilla-Arróspide, 2021).
Some authors have used social media analytics to mine and analyze a large number of tweets to extract useful patterns and information from many fields (Congosto, Basanta-Val and Sanchez-Fernandez, 2017; Crisci et al., 2018; Liere-Netheler et al., 2019), or by using social network analysis (SNA) (Angelopoulos and Merali, 2017), they have developed visual graphs (Barabási, 2016) to discuss the nature of connections (Zuo et al., 2020).
In previous agrifood-related research using Twitter data, wordcount analysis has dominated (Carr et al., 2015; Fried et al., 2014; Ruggeri and Samoggia, 2018). Other attempts to generate knowledge from UGC for the benefit of marketers were largely confined to content analysis (Vidal et al., 2015), sentiment analysis (Alaparthi and Mishra, 2021; Chakraborty et al., 2020; Ibrahim, Wang and Bourne, 2017; Mostafa, 2019; Recuero-Virto and Valilla-Arróspide, 2021) or text analysis using machine learning (ML) techniques (Moreno-Sandoval et al., 2018; Singha, Shuklab, and Mishrac, 2018). However, these investigations were not enriched by the identification of hidden patterns (Mishra, 2021).
3. Materials and Methodology
This study drew upon Kar and Dwivedi’s (2020) theory building on big data-driven research. In the first stage, retailers were selected, and their tweets were extracted with the application programming interface (API) from their official Twitter accounts. Then, the datasets were cleaned and tokenized in order to better analyze the data through exploratory analysis and tag frequency. Finally, SNA was used to identify association rules among retailers.
We chose Twitter as the source of food retailer interest for two reasons. First, tweets are publicly exposed and, therefore, more reflective of true user interest. Second, Twitter’s extent is broad, and the extraction costs are low.
3.1. Selected sample
The first step was to select the companies that would be the objects of research. Consumers usually go to supermarkets and hypermarkets to make food purchases (EAE Business School, 2018). Specifically, in the agri-fresh produce sector, both supermarkets and hypermarkets are the preferred channels.
Thirty-eight European food retailers were included out of the two hundred and fifty leading retailers worldwide. Selecting those that operated in either the UK or Spain (Deloitte TTL, 2018) and discarding those that did not have an official Twitter account or a minimum of 10,000 followers and 5000 published tweets, a final list of 16 food retailers was obtained. To ensure a more balanced list, we proceeded to add Consum Supermarkets (Kantar Worldpanel, 2018) to the Spanish selection of retailers. Thus, we worked with a final sample of 17 food retailers, 9 from the UK and 8 from Spain (Table 1).
Table. 1. The selected Spanish and UK food retailers.
|
Market |
Retailer |
Tweets |
Followers |
|
UK |
|
|
|
|
1 |
Aldi |
183,000 |
371,000 |
|
2 |
Tesco |
2,170,000 |
549,000 |
|
3 |
Sainsburys |
790,000 |
523,000 |
|
4 |
Morrisons |
335,000 |
282,000 |
|
5 |
Spar |
5,653 |
13,878 |
|
6 |
Coop |
115,000 |
141,000 |
|
7 |
Iceland Foods |
86,700 |
168,000 |
|
8 |
Waitrose |
175,000 |
325,000 |
|
9 |
Asda |
16,900 |
460,000 |
|
Spain |
|
|
|
|
1 |
Lidl |
19,300 |
135,000 |
|
2 |
Aldi |
6,966 |
12,300 |
|
3 |
Carrefour |
49,100 |
225,000 |
|
4 |
Alcampo |
23,200 |
67,800 |
|
5 |
Mercadona |
88,500 |
170,000 |
|
6 |
DIA |
14,600 |
59,600 |
|
7 |
EROSKI |
25,300 |
55,400 |
|
8 |
Consum |
27,600 |
16,600 |
Source: Twitter.com (27-6-2019)
To avoid bot accounts, which spread fake news and manipulate opinions, the literature proposes automatic algorithms (Hayawi et al., 2022). In our case, we studied each retailer’s official Twitter account, comparing them with different sources such as their websites.
3.2. Twitter data extraction
As with many social networks, Twitter makes available to users an API that allows information to be extracted from its platform. To interact with the API, we used the “twitteR” package (Gentry, 2015) for R (R Core Team, 2018). After creating a Twitter App associated with the user’s account and registering with open authorization (OAuth), Twitter provides the identification keys and tokens that allow access to the application and the extraction of information.
Each Twitter message is presented in the JSON (JavaScript object notation) format and consists of many attributes. From the information automatically retrieved, only the author of the tweet, the date of publication, the tweet identifier and the content of the message were used in the analysis. The extraction of data was carried out in October 2019, generating a total of 54,400 original tweets (including retweets and replies). This number was based on the constraints of Twitter’s API, which only returns the 3200 most recent tweets posted per user (Twitter, 2022).
To compare the data between the two markets, we decided to establish a two-year analysis period, from October 2017 to October 2019.
3.3. Tweet cleaning and tokenization
Before conducting the text analysis, the cleaning and tokenization processes were automated by a function implemented in R code.
Repeated tweets were removed from the final sample, though not retweets and replies. This difference mattered, because they reflect the interest of retailers to share information offered by consumers or to respond to their interests.
There is no single way to preprocess a dataset, it depends on the purpose of the analysis and the source from which the text comes. For example, in social networks, users can write in any style they want, which usually results in the high use of abbreviations and punctuation marks.
The dataset was cleaned by purging from the text everything that was not readable (i.e., punctuation marks, HTML and Arabic or Cyrillic characters) and converting the remaining text into lowercase. The next step was word tokenization, or the separation of tweets into individual units with meaning, which were hashtags in our research. In total, this study analyzed a sample of 10,131 tweets containing hashtags. When performing tokenization, each list of tokens (i.e., hashtags) must be nested, multiplying the number of records by as many times the hashtags appear in a tweet.
3.4. Twitter data analysis
As any manual labeling process can be time consuming, the unstructured texts (i.e., tweets) captured using the above method and transformed into structured texts (i.e., hashtags) by the utilization of the tokenization technique were utilized for exploratory analysis and word frequency employing classification techniques (Yanai and Kawano, 2014).
Finally, the social networks were represented with Gephi (Bastian, Heymann, and Jacomy, 2009), an open-source visualization software, and the associations among retailers were analyzed using modularity techniques (Blondel et al., 2008).
4. Results
4.1. Exploratory analysis
Although the Twitter activity surveyed for most of the retailers covered the last two years, a different activity profile could be observed for each supermarket. We can see from Figure 1 that, except for Spar, the most recent 3200 tweets recovered from each UK supermarket’s account were from the years 2018 and 2019. In the Spanish case, the 3200 tweets were from a slightly longer time range (Figure 2).
Figure. 1. Temporal distribution of extracted tweets related to UK accounts.
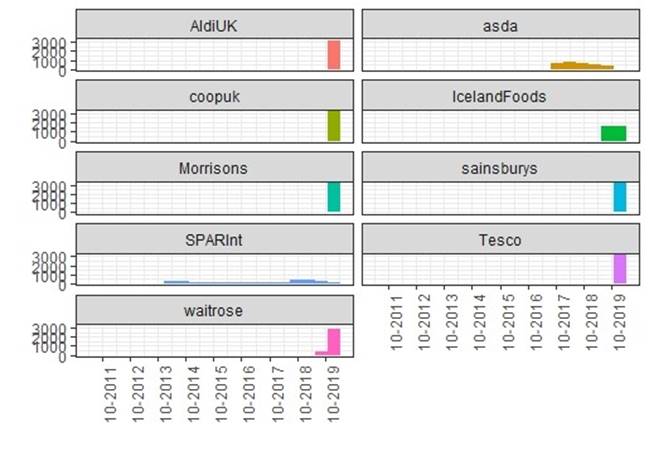
Figure. 2. Temporal distribution of the extracted tweets related to Spanish accounts.
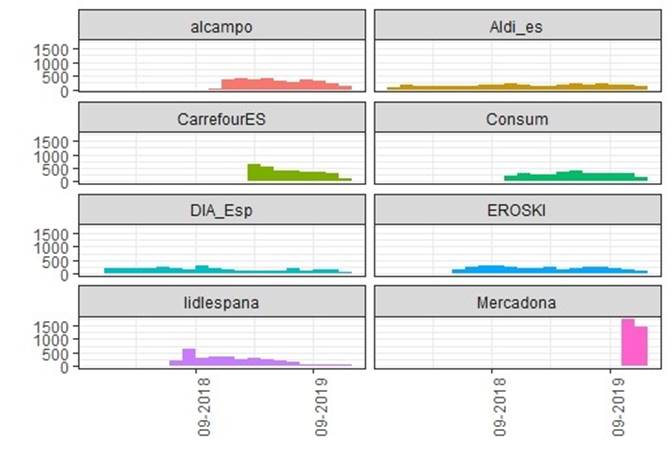
Due to the limitations that Twitter imposes on recoveries, the more active the user, the shorter the time interval during which tweets are recovered. For most of the UK accounts, as well as the Spanish Mercadona account, since they published much more frequently than the other accounts, with the same number of tweets recovered, the time range covered was less than half that of the others (see Figure 1 and Figure 2). This indicates that the UK accounts were more active than the Spanish ones.
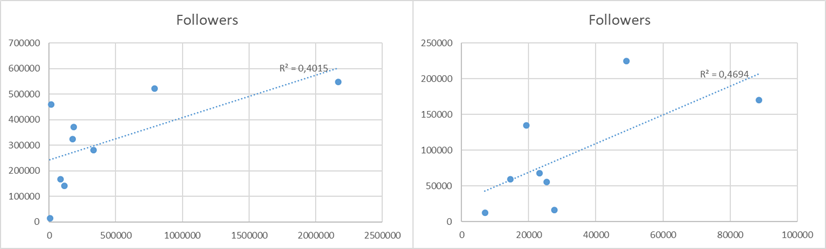
On the other hand, the activity on Twitter was greater for the UK accounts than for the Spanish, since the average number of tweets posted since its inception has been greater: 430,806 versus 31,821 tweets (Table 2). This activity, represented by the number of publications (i.e., tweets), was positively correlated with the number of followers (Figure 3), with the Tesco, Sainsbury’s, CarrefourES, and Mercadona accounts having the most followers (Table 2).
Figure. 3. Scatter diagrams and regression lines (left: UK; right: Spain).
However, the accounts with more activity on Twitter were not always the ones that accumulated the most “likes”. In fact, Tesco and Mercadona received very few “likes”.
Table. 2. Twitter activity of the retailers.
|
User account |
Date |
Tweets |
Following |
Followers |
Likes |
|
UK |
|
|
|
|
|
|
AldiUK |
04-2009 |
183,000 |
3718 |
371,000 |
85,100 |
|
Tesco |
03-2011 |
2,170,000 |
169,000 |
549,000 |
4125 |
|
Sainsburys |
10-2009 |
790,000 |
56,300 |
523,000 |
4461 |
|
Morrisons |
12-2010 |
335,000 |
19,800 |
282,000 |
42,100 |
|
SparInt |
03-2011 |
5653 |
414 |
13,878 |
2767 |
|
Coopuk |
06-2009 |
115,000 |
464 |
141,000 |
29,800 |
|
IcelandFoods |
03-2009 |
86,700 |
2413 |
168,000 |
23,400 |
|
Waitrose |
06-2009 |
175,000 |
6588 |
325,000 |
18,100 |
|
Asda |
02-2009 |
16,900 |
1174 |
460,000 |
12,400 |
|
|
Mean |
430,806 |
|
|
|
|
Spain |
|
|
|
|
|
|
Lidlespana |
07-2011 |
19,300 |
1020 |
135,000 |
9669 |
|
Aldi_es |
07-2014 |
6966 |
129 |
12,300 |
4188 |
|
CarrefourEs |
04-2011 |
49,100 |
1692 |
225,000 |
61,300 |
|
Alcampo |
10-2012 |
23,200 |
507 |
67,800 |
6745 |
|
Mercadona |
07-2011 |
88,500 |
44 |
170,000 |
864 |
|
DIA_esp |
07-2012 |
14,600 |
2272 |
59,600 |
3176 |
|
EROSKI |
10-2010 |
25,300 |
2671 |
55,400 |
913 |
|
Consum |
07-2010 |
27,600 |
1690 |
16,600 |
14,300 |
|
|
Mean |
31,821 |
|
|
|
Source: Twitter.com (27-6-2019).
4.2. Hashtag frequency
When it comes to understanding what each retailer chooses to communicate and, therefore, what interests them, it is worth studying the hashtags they use and how often they use them as well as discussing their meaning.
Table. 3. The total number of hashtags used by each user’s account.
|
UK User account |
Hashtags by Retailer A |
Hashtags by Followers B (B/A%) |
Total Hashtags
|
|
1 AldiUK 2 asda 3 coopuk 4 IcelandFoods 5 Morrisons 6 sainsburys 7 SPARInt 8 Tesco 9 waitrose |
105 1042 44 73 59 1 1201 3 3 |
1447474231516091515 |
|
|
Total |
2531 |
1366 (53.97%) |
3897 |
|
Spanish User account |
Hashtags by Retailer A |
Hashtags by Followers B (B/A%) |
Total Hashtags
|
|
1 alcampo 2 Aldi_es 3 CarrefourES 4 Consum 5 DIA_Esp 6 EROSKI 7 lidlespana 8 Mercadona |
435 170 1470 875 310 624 127 22 |
21858918673110122057 |
|
|
Total |
4033 |
2201 (54.57%) |
6234 |
Source: Own elaboration
Spanish food retailer accounts registered a greater number of hashtags—a total of 6234 compared to 3897 for the UK food retailer accounts. In both markets, the percentage of hashtags corresponding to supermarkets compared to those published by their followers was similar: 54% (Table 3). The UK food retailers that used the most hashtags were SPAR and Asda, while in Spain, it was Carrefour and Consum.
The hashtags most used by UK food retailer accounts were related to lifestyle (goodliving), cooking (recipe), health (vegan) and special days (fathersday), while UK followers were mainly interested in health (glutenfree and vegan) (Table 4).
Table. 4. The top 20 hashtags by frequency from the UK food retailer accounts.
|
Total UK Hashtags |
Frequency |
UK Hashtags by Retailers |
Frequency |
UK Hashtags by Followers |
Frequency |
|
|
1 |
spar |
868 |
spar |
772 |
spar |
96 |
|
2 |
goodliving |
368 |
goodliving |
362 |
itswhatwedo |
32 |
|
3 |
recipe |
127 |
recipe |
123 |
glasgow |
31 |
|
4 |
freefrom |
87 |
freefrom |
70 |
ec |
27 |
|
5 |
vegan |
75 |
meatfreemonday |
54 |
everylittlehelps |
25 |
|
6 |
meatfreemonday |
54 |
vegan |
52 |
glutenfree |
25 |
|
7 |
sparcongress |
54 |
sparcongress |
49 |
vegan |
23 |
|
8 |
itswhatwedo |
40 |
fathersday |
30 |
retail |
22 |
|
9 |
glasgow |
38 |
unicorn |
26 |
tesco |
20 |
|
10 |
retail |
33 |
fishfriday |
22 |
freefrom |
17 |
|
11 |
unicorn |
33 |
win |
17 |
asda |
15 |
|
12 |
fathersday |
32 |
bankholiday |
13 |
offers |
14 |
|
13 |
ec |
29 |
easter |
13 |
tescomealdeal |
13 |
|
14 |
glutenfree |
29 |
sparchina |
12 |
tilburg |
12 |
|
15 |
everylittlehelps |
25 |
eurospar |
11 |
beingcoop |
11 |
|
16 |
win |
24 |
logit |
11 |
bettertogether |
9 |
|
17 |
fishfriday |
22 |
retail |
11 |
tasty |
9 |
|
18 |
tesco |
20 |
bbq |
10 |
berlin |
8 |
|
19 |
easter |
18 |
christmasbreakfas |
10 |
themoment |
8 |
|
20 |
asda |
17 |
Sparuk |
10 |
icelandcharityweek |
7 |
Source: Own elaboration
The hashtags that Spanish food retailers used the most were those related to cooking (i.e., recipeeroski, recipes and recipe) and health (i.e., bio, vivebio and singluten), while Spanish followers tended to publish hashtags regarding campaigns (i.e., concorazon, challenge, maintenance, and Christmas) or health (i.e., vivebio, mayosingluten and bio) (Table 5).
Table. 5. The top 20 hashtags by frequency from the Spanish food retailer accounts.
|
Total Spanish Hashtags |
Frequency |
Spanish Hashtags by Retailers |
Frequency |
Spanish Hashtags by Followers |
Frequency |
|
|
1 |
alcampo |
143 |
Alcampo |
143 |
yonavideo |
112 |
|
2 |
yonavideo |
135 |
recetaeroski |
94 |
sushicarrefour |
92 |
|
3 |
concorazón |
106 |
carrefourtex |
69 |
concorazón |
90 |
|
4 |
sushicarrefour |
100 |
eroskiclub |
69 |
millones |
62 |
|
5 |
recetaeroski |
96 |
Navidad |
65 |
reto |
62 |
|
6 |
carrefourtex |
84 |
Bio |
58 |
empresas |
21 |
|
7 |
navidad |
81 |
recetaeroskiconsumer |
55 |
masquepanenlidl |
21 |
|
8 |
reto |
79 |
navidear |
52 |
vivebio |
20 |
|
9 |
millones |
78 |
recetasconsum |
46 |
mayosingluten |
18 |
|
10 |
bio |
73 |
carrefourbio |
44 |
hacerlacompracon |
17 |
|
11 |
eroskiclub |
69 |
Ofertas |
43 |
retail |
17 |
|
12 |
carrefourbio |
59 |
Receta |
41 |
felizlunes |
16 |
|
13 |
vivebio |
56 |
buenosdías |
39 |
mantenlainocencia |
16 |
|
14 |
recetaeroskiconsumer |
55 |
inextenso |
39 |
navidad |
16 |
|
15 |
navidear |
53 |
Vivebio |
36 |
bio |
15 |
|
16 |
buenosdías |
49 |
marcadecarrefour |
34 |
carrefourbio |
15 |
|
17 |
recetasconsum |
48 |
singluten |
30 |
carrefourtex |
15 |
|
18 |
ofertas |
46 |
calidadyorigen |
29 |
consum |
15 |
|
19 |
receta |
44 |
clubcarrefour |
29 |
ecommerce |
15 |
|
20 |
marcacarrefour |
41 |
marcacarrefour |
27 |
felizmartes |
15 |
Source: Own elaboration
Although every retailer cares about health, we can see a difference between the markets, with the UK having a greater impact on special days and lifestyle and Spain on health and recipes. With regard to followers, for both of them (i.e., UK and Spain), they were mainly health focused, but social issues were also significant for Spanish followers.
4.3 Network analysis
This section identifies hidden links among supermarkets based on two network structures: degree centrality (Borgatti, 2005; Freeman, 1979), or the contribution of one retailer according to its connections, and modularity (Blondel et al., 2008), or the division of a retailer’s network into clusters.
The bipartite retailer–hashtag network was visualized using the Fruchterman–Reingold and Force Atlas 2 algorithms, because both of them attract the most central nodes and separate the others (Aggrawal and Arora, 2016). Figure 4 represents the changes in the structure obtained with the application of these spatialization algorithms.
Figure. 4. Spatial distribution of the network before and after the application of the Fruchterman–Reingold and Force Atlas 2 algorithms.
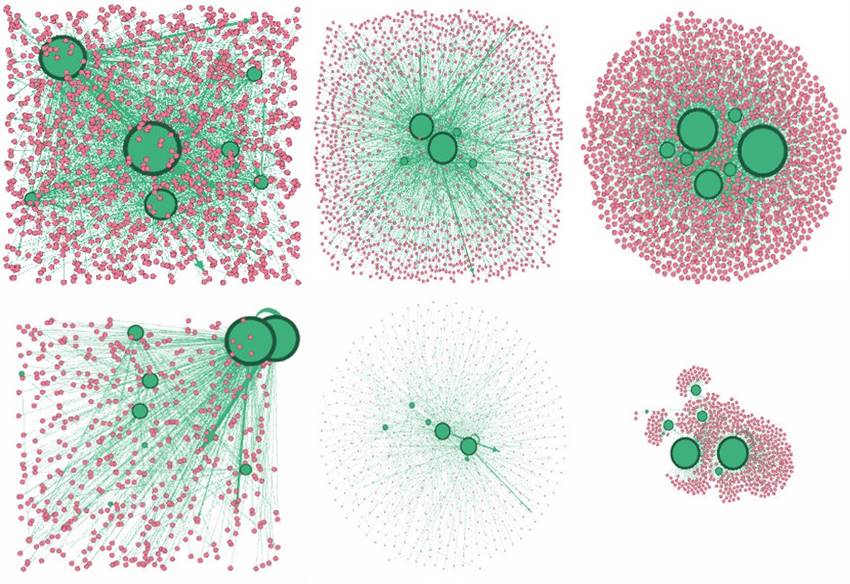
From left to right: No distribution, Fruchterman–Reingold, and Force Atlas 2 (top UK, bottom Spain).
The network topology did not have many elements, but it was possible to perceive that the largest nodes were concentrated in the center of the network, while a large number of smaller nodes were located at the periphery.
However, this network was still heavily contaminated by the presence of nodes that represent hashtags (pink). This occurred because the network as built was based on the retailer–hashtag relationship—Twitter networks are directed, meaning that each link has a direction (user–tweet)—and it was necessary to transform the bipartite network into a unipartite network (retailer–retailer).
After transforming the network, the final procedure was the detection of communities where node colors were classified under the criteria of “modularity class” (Figure 5).
Figure. 5. Final spatial distribution of the supermarket network centrality (left: UK; right: Spain).
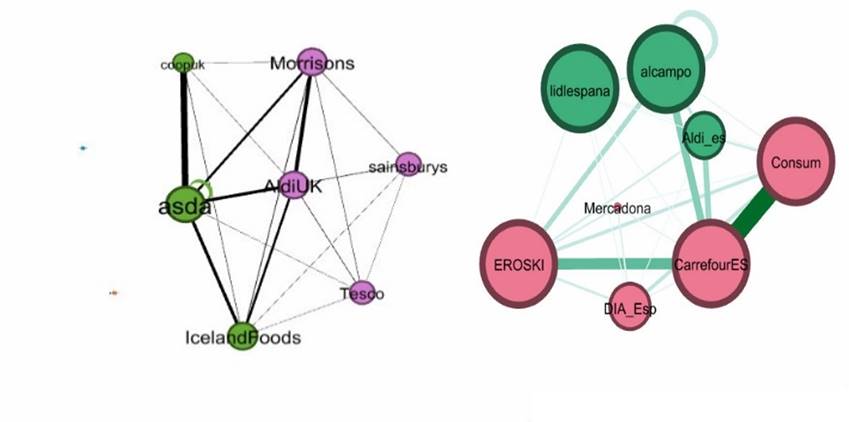
In Figure 5 we can see two communities: Asda, Iceland Foods and Co-op represented one community and Aldi, Morrisons, Tesco and Sainsburys the other. In the Spanish network, Lidl, Alcampo and Aldi belonged to one community and Eroski, Carrefour, Consum, Dia and Mercadona to the other.
In this figure, we can also see that Asda had a high level of centrality in the UK network (node size) and a strong relationship with Co-op (edge thickness).
A similar result was obtained from the Spanish network, where Carrefour stood out for its importance and strong relationship with, among others, Consum and Eroski. It is worth mentioning two results: first, the small relevance of Mercadona in the Spanish network, both in the degree of centralization and in their relationships; second, Lidl had a high degree in the network but very few connections with the other supermarkets.
5. Discussion
The result of our study shows useful insights. Analyzing food retailers’ generated content on Twitter using wordcount, content analysis and SNA, several characteristics were detected that could be relevant for the suppliers of these food retailers.
The objective related to first research question was to analyze the Twitter activity among supermarkets, even within each geographic region. The results of the present study indicate that food retailers were using their Twitter accounts in a way (a) related to communication (unidirectional) and (b) another more oriented toward interaction with users (bidirectional), engaging with retweets and replies. Aligned with the former, there were supermarkets that posted many tweets, such as Tesco, Sainsbury’s or Mercadona and CarrefourEs, who seek a strong presence and positioning on social networks as indicated by Kwat et al. (2020). With the second strategy, oriented to obtaining more “likes”, where supermarkets focused on publishing content of interest to their consumers, such as AldiUK, Morrisons, CarrefourEs and Consum, or for relationship and fan acquisition (Kim and Ko, 2012) with a higher rate of conversion of followers (followers/tweets), such as by Asda, AldiUK, Lidlespana and CarrefourEs, or “likes” (likes/tweets) such as by Asda, AldiUK, CarrefourEs or Aldi_es.
Related to the second research question, our analysis confirmed different discourses among food retailers’ topics. On the one hand, the study detected a communication strategy, which could be divided into brand communication (Erdogmus and Tatar, 2015), such as by Spar and Alcampo, whose hashtags were related to their brands, and communication of values such as by Morrisons and Mercadona (Ladhari et al., 2019). As also seen in content analysis and in line with the literature on food choice (for example, Bisogni et al., 2007; Meiselman, 2008), a large proportion of the tweets were motivated by a special event, most often days or special dates, such as “father’s day” or “Christmas”. Information on discounts, recommended recipes and entering contests were other common topics. The findings from the current research suggest informative and enjoyment values as the most important motives, as Ladhari et al. (2019) pointed out. The results also confirm that retailers communicated about sustainability (Ruggeri and Samoggia, 2018). Finally, the quantitative content analysis of Twitter messages, from both retailers and followers, showed that they were interested in healthy eating topics (Chen, 2013; Samoggia, Bertazzoli, and Ruggeri 2019). Thus, Twitter could be a helpful as a platform as a source of information to learn, in this case, about the food retailers’ value perceptions (Elghannam, et al., 2020).
Finally, regarding the last research question, this study revealed which retailers were most similar, such that targeted group marketing strategies can be proposed. Tesco and Sainsbury’s, which had the most tweets and followers, were of very little importance in the hashtag network, and they were not connected to other UK supermarkets. Similarly, Mercadona, which was the most Spanish active account on Twitter, did not stand out in this network and was not connected to the other supermarkets, mainly because it did not usually use hashtags in their tweets, which reinforces their informational position more than the use of keywords to gain engagement. It is interesting to note how in mid-2021 Lidl left the Association of Spanish Supermarket Chains (ACES) that brings together Carrefour, Alcampo and Eroski to join the Spanish Association of Distributors, Self-Services and Supermarkets (Adesas) with Mercadona and Dia (Food Retail, 2021). Precisely these three supermarkets were the ones with the fewest connections in the network.
6. Conclusions
User-generated content, in general, and tweets, in particular, offer opportunities for deep insights into food retailers’ interests. We found that the adoption of Twitter data analytics for marketing managers of agrifood cooperatives could be very useful for advancing customer-centric strategies.
Applying new techniques promoted by this network revolution, such as data mining and online social network analysis, we conducted research on the European retail food industry, focusing on the Spanish and UK markets, in order to help agrifood cooperatives reduce information asymmetries in relation to retailers.
UGC can offer opportunities for agrifood cooperatives to better understand both their customers and consumers’ behavior. The results of this study provide a much needed first step in this direction. With this analysis and its representation of social networks, we aimed to provide new and useful knowledge for fresh and perishable product suppliers from food retailers’ Twitter data.
This study collected and analyzed a total of 54,000 tweets from 17 food retailers from the social media platform Twitter. Currently, this is the first study that categorized Twitter food retailers’ opinions using hashtags and revealed the differences among these food retailers and the latent topics and links resulting in such user-generated content.
The study makes three important contributions to our understanding of communication with food retailers’ customers.
First, our study demonstrated certain supermarkets’ affinity in terms of their activity, and certain supermarkets’ affinity regarding their type of communication. In relation to the first, it was confirmed that there were supermarkets with many tweets and followers but which did not have much attention paid to them—such as Tesco, Sainsbury’s and Morrisons in the UK and Mercadona in Spain. With respect to the second, the analysis of the data from Twitter accounts revealed that other supermarkets, mainly Aldi and Asda in the UK and Carrefour in Spain, maintained a much richer activity in their discourse pursuing more “likes” and followers.
In relation to the second research question, hashtag analysis was performed to extract the relevant themes and similarities among supermarkets’ social media strategies.
Examining the terms that appeared most frequently in the tweets, we noted that the most important hashtags were semantically grouped into areas related to a healthy lifestyle, gastronomy and campaigns, and words that denoted the presence of an increasingly occurring trend in people’s lifestyle, such as those hashtags related to leading a healthy life and a balanced diet. In general, all supermarkets attached great importance to lifestyle and healthy diet. In turn, the mention of special days or dates, such as Father’s Day, and solidarity campaigns were also of interest and relevant elements in the communication strategy of food retailers. Knowing this is important for agrifood cooperatives, who can thus identify which distribution channel, in this case a food retailer, is the most appropriate to develop their marketing strategy and place their product on the market.
Third, SNA in mode one and the detection of communities also confirmed the existence of an affinity among certain supermarkets. It was notable that Asda and Carrefour were the supermarkets with a greater presence and number of relationships in their networks; Asda had greater affinity with Aldi and Coop and Carrefour Consum and Eroski. It was also notable that Mercadona, the main Spanish food supermarket, followed a different strategy from that of the other Spanish supermarkets. It would be a good strategy by the coops to choose the most appropriate community that is more aligned with their general objectives.
Based on the results obtained, different goals and objectives can be defined in marketing strategies. For example, product brand activities can be used to present new offers and raise awareness, stimulate interest in existing products or play a public relations role by including content that builds or improves the overall image of an organization. Participatory activities, such as sweepstakes and contests, can serve to generate enthusiasm for a brand and/or organization, thus achieving the objectives of creating sympathy and affinity. In addition, sales promotion activities stimulate sales by providing consumers with an incentive to buy now.
Beyond finding the answers to the proposed questions, new questions also arise, namely, Are supermarket strategies on Twitter consistent with their real marketing strategies? Is there a different communication by type of food product? What are the forces that act in the choice of one hashtag rather than another by food retailers? We leave these opportunities for future research.
Similarly, we also encountered limitations. First, the study analyzed a limited number of tweets and hashtags and from an isolated social media platform, Twitter. There are different social media networks and other user-generated content such as emoticons or images. Second, there are other algorithms based on sentiment analysis or machine learning techniques. Third, these findings can be validated by case study, either for other agrifood-related products or food markets.
Finally, this research provides useful information that can help agrifood cooperatives establish more coherent management strategies and relationships with their food retailers. Monitoring food retailers’ opinions and understanding Twitter data allow agrifood cooperatives to make more informed decisions (Tao, Yang, and Feng, 2020).
Conflicts of Interest: The authors declare no conflicts of interest.
Funding: This research received no external funding.
7. References
Aggrawal, N. and Arora, A. (2016) Visualization, analysis and structural pattern infusion of DBLP co-authorship network using Gephi. IEEE 2016 2nd International Conference on Next Generation Computing Technologies (NGCT), pp. 494-500. DOI: 10.1109/NGCT.2016.7877466.
Alaparthi, S. and Mishra, M. (2021) BERT: A sentiment analysis odyssey. Journal of Marketing Analytics, Vol. 9, Nº 2, pp. 118-126. DOI:10.1057/s41270-021-00109-8.
Andrews, R.L. and Currim, I.S. (2004) Behavioural differences between consumers attracted to shopping online versus traditional supermarkets: implications for enterprise design and marketing strategy. International Journal of Internet Marketing and Advertising, Vol. 1, Nº 1, pp. 38-61. DOI: 10.1504/IJIMA.2004.003689
Angelopoulos, S. and Merali, Y. (2017) Sometimes a cigar is not just a cigar: Unfolding the transcendence of boundaries across the digital and physical. ICIS international conference in information systems. Vol. 17. https://aisel.aisnet.org/icis2017/SocialMedia/Presentations/17.
Araújo Britto Sass, C., Colombo Pimentel, T., Gonzalez Barandela Aleixo, M., Mendes Dantas, T., Cyrino Oliveira, F.L., Queiroz de Freitas, M., Gomes da Cruz, A. and Almeida Esmerino, E. (2020) Exploring social media data to understand consumers’ perception of eggs: a multilingual study using Twitter. Journal of Sensory Studies, Vol. 35, Nº 6. DOI: 10.1111/joss.12607.
Barabási, A. L. (2016) Network science. Cambridge University Press.
Bastian, M., Heymann, S. and Jacomy, M. (2009) Gephi: an open source software for exploring and manipulating networks. Association for the Advancement of Artificial Intelligence (www.aaai.org). Extracted from https://gephi.org/publications/gephi-bastian-feb09.pdf (accessed 23 February 2021).
Bisogni, C.A., Winter Falk, L., Madore, E., Blake, C.E., Jastran, M., Sobal, J. and Devine, C.M. (2007) Dimensions of everyday eating and drinking episodes. Appetite, Vol. 48, Nº 2, pp. 218–231. DOI: 10.1016/j.appet.2006.09.004.
Blondel, V.D., Guillaume, J.L., Lambiotte, R. and Lefebvre, E. (2008) Fast unfolding of communities in large networks. Journal of Statistical Mechanics: Theory and Experiment, Vol. 2008, Nº 10, P10008. DOI: 10.48550/arXiv.0803.0476.
Borgatti, S.P. (2005) Centrality and network flow. Social Networks, Vol. 27, Nº, pp. 55–71. DOI: 10.1016/j.socnet.2004.11.008.
Boyd, D.M. and Ellison, N.B. (2007) Social network sites: Definition, history, and scholarship. Journal of Computer‐Mediated Communication, Vol. 13, Nº 1, pp. 210-230. DOI: 10.1111/j.1083-6101.2007.00393.x.
Buskens, V. (2020) Spreading information and developing trust in social networks to accelerate diffusion of innovations. Trends in Food Science and Technology, Vol. 106, pp. 485-488. DOI: 10.1016/j.tifs.2020.10.040.
Carr, J., Decreton, L., Qin, W., Rojas, B., Rossochacki, T. and Wen Yang, Y. (2015) Social media in product development. Food Quality and Preference, Vol. 40, Part B, pp. 354–364. DOI: 10.1016/j.foodqual.2014.04.001.
Chakraborty, K., Bhatia, S., Bhattacharyya, S., Platos, J., Bag, R. and Hassanien, A.E. (2020) Sentiment Analysis of COVID-19 tweets by Deep Learning Classifiers—a study to show how popularity is affecting accuracy in social media. Applied Soft Computing, Vol. 97, Nº A, p. 106754. DOI: 10.1016/j.asoc.2020.106754.
Chen, M.-F. (2013) Influences of health consciousness on consumers’ modern health worries and willingness to use functional foods. Journal of Applied Social Psychology, Vol. 43, Nº S1, pp. E1–E12. DOI: https://doi.org/10.1111/jasp.12033.
Congosto Martínez, M. L., Basanta Val, P., and Sánchez Fernández, L. (2017) T-Hoarder: A framework to process Twitter data streams. Journal of Network and Computer Applications, Vol. 83, pp. 28-39. DOI: 10.1016/j.jnca.2017.01.029.
Crisci, A., Grasso, V., Nesi, P., Pantaleo, G., Paoli, I. and Zaza, I. (2018) Predicting TV programme audience by using twitter based metrics. Multimedia Tools and Applications, Vol. 77, Nº 10, pp. 12203–12232. DOI: 10.1007/s11042-017-4880-x.
Cucagna, M.E. and Goldsmith, P.D. (2018) Value adding in the agri-food value chain. International Food and Agribusiness Management Review, Vol. 21, Nº 3, pp. 293-316. DOI: 10.22434/IFAMR2017.0051.
Degeratu, A.M., Rangaswamy, A. and Wu, J. (2000) Consumer choice behavior in online and traditional supermarkets: The effects of brand name, price, and other search attributes. International Journal of research in Marketing, Vol. 17, Nº 1, pp. 55-78. DOI: 10.1016/S0167-8116(00)00005-7.
Deloitte TTL (2018) Global Powers of Retailing 2018. Deloitte Touche Tohmatsu, London. Extracted from https://www2.deloitte.com/ni/es/pages/consumer-business/articles/global-powers-of-retailing-2018.html (accessed 30 July 2021).
Ducange, P., Fazzolari, M., Petrocchi, M. and Vecchio, M. (2019) An effective Decision Support System for social media listening based on cross-source sentiment analysis models. Engineering Applications of Artificial Intelligence, Vol. 78, pp. 71–85. DOI: 10.1016/j.engappai.2018.10.014.
Dwivedi, Y. K., Ismagilova, E., Hughes, D. L., Carlson, J., Filieri, R., Jacobson, J., … Wang, Y. (2020) Setting the future of digital and social media marketing research: Perspectives and research propositions. International Journal of Information Management, Vol. 59. DOI: 10.1016/j.ijinfomgt.2020.102168.
EAE Business School (2018) La situación de la gran distribución en el mercado de consumo. https://www.eae.es/ (accessed 26 May 2021).
Elghannam, A., Mesias, F.J., Escribano, M., Fouad, L., Horrillo, A. and Escribano, A.J. (2020) Consumers’ perspectives on alternative short food supply chains based on social media: a focus group study in Spain. Foods, Vol. 9, Nº 1, p. 22. https://doi.org/10.3390/foods9010022.
Erdogmus, Đ.E. and Tatar, S.B. (2015) Drivers of Social Commerce through Brand Engagement. Procedia-Social and Behavioral Sciences, Vol. 207 (20 October), pp. 189-195. DOI: 10.1016/j.sbspro.2015.10.087.
Fleming-Milici, F. and Harris, J.L. (2020) Adolescents’ engagement with unhealthy food and beverage brands on social media. Appetite, Vol. 146, p. 104501. DOI: 10.1016/j.appet.2019.104501.
Freeman, L.C. (1979) Centrality in social networks: Conceptual clarification. Social Networks, Vol. 1, Nº 3, pp. 215–239. DOI: 10.1016/0378-8733(78)90021-7.
Fried, D., Surdeanu, M., Kodbourov, S., Hingle, M. and Bell, D. (2014) Analyzing the language of food on social media. In: 2014 IEEE International Conference on Big Data, October 27–30th, 2014, Washington, EEUU.
Food Retail (2021). Lidl abandona Aces y se une a Asedas https://www.foodretail.es/retailers/cadena-supermercados-Lidl-socio-Asedas_0_1555344472.html (accessed 8 May 2022).
Gentry, J. (2015) twitteR. R package version 1.1.9. Extracted from https://www.rdocumentation.org/packages/twitteR/versions/1.1.9 (accessed 1 May 2021).
Go, E., and You, K. H. (2016) But not all social media are the same: Analyzing organizations’ social media usage patterns. Telematics and Informatics, Vol. 33, Nº 1, pp. 176–186. DOI: 10.1016/j.tele.2015.06.016.
Grewal, D., Levy, M. and Kumar, V. (2009) Customer experience management in retailing: An organizing framework. Journal of Retailing, Vol. 85, Nº 1, pp. 1-14. DOI: 10.1016/j.jretai.2009.01.001.
Grewal, D. and Roggeveen, A.L. (2020) Understanding retail experiences and customer journey management. Journal of Retailing, Vol. 96, Nº 1, pp. 3-8. DOI: 10.1016/j.jretai.2020.02.002.
Hayawi, K., Mathew, S., Venugopal, N. et al. (2022) DeeProBot: a hybrid deep neural network model for social bot detection based on user profile data. Social Network Analysis and Mining, Vol. 12, Nº 43. DOI: 10.1007/s13278-022-00869-w.
Ibrahim, N. F., Wang, X. and Bourne, H. (2017) Exploring the effect of user engagement in online Brand communities: Evidence from Twitter. Computers in Human Behavior, Vol. 72, pp. 321-338. DOI: 10.1016/j.chb.2017.03.005.
Imhof, G. and Klaus, P. (2020) The dawn of traditional CX metrics? Examining satisfaction, EXQ, and WAR. International Journal of Market Research, Vol. 62, Nº 6, pp. 673-688. DOI: 10.1177/1470785319848955.
Jacobsen, L.F., Stancu, V., Wang, Q.J., Aschemann-Witzel, J. and Lähteenmäki, L. (2021) Connecting food consumers to organisations, peers, and technical devices: the potential of interactive communication technology to support consumers’ value creation. Trends in Food Science and Technology, Vol. 109, pp. 622-631. DOI: 10.1016/j.tifs.2021.01.063.
Kantar WorldPanel (2018) Tendencias en la distribución 2018. Extracted from https://www.kantarworldpanel.com/es/Noticias/el-gran-consumo-crece-un-1porciento-en-los-8-primeros-meses (accessed 8 June 2021).
Kaplan, A.M. and Haenlein, M. (2010) Users of the world, unite! The challenges and opportunities of Social Media. Business Horizons, Vol. 53, pp. 59–68. DOI: 10.1016/j.bushor.2009.09.003.
Kar, A.K. and Dwivedi, Y.K. (2020) Theory building with big data-driven research – Moving away from the “What” towards the “Why”. International Journal of Information Management, Vol. 54, pp. 1-10. DOI: 10.1016/j.ijinfomgt.2020.102205.
Kim, A. J. and Ko, E. (2012) Do social media marketing activities enhance customer equity? An empirical study of luxury fashion Brand. Journal of Business Research, Vol. 65, Nº 10, pp. 1480-1486. DOI: 10.1016/j.jbusres.2011.10.014.
Kwak, H., Lee, C., Park, H. and Moon, S. (2010) What is Twitter, a Social Network or a News Media? In: Proceedings of the 9th International World Wide Web (WWW) Conference, April 26–30, 2010, Raleigh, North Carolina, USA.
Ladhari, R., Rioux, M.-C., Souiden, N. and Chiadmi, N.-E. (2019) Consumers’ motives for visiting a food retailer's Facebook page. Journal of Retailing and Consumer Services, Vol. 50, pp. 379-385. DOI: 10.1016/j.jretconser.2018.07.013,
Liere-Netheler, K., Gilhaus, L., Vogelsang, K., and Hoppe, U. (2019) A literature review on application areas of social media analytics. In: Abramowicz, W. and Corchuelo, R. (Eds.). Business Information Systems. Cham: Springer, pp. 38-49. DOI: 10.1007/978-3-030-20482-2_4.
Liu, X., Burns, A.C. and Hou, Y. (2017) An investigation of brand-related user-generated content on Twitter. Journal of Advertising, Vol. 46, Nº 2, pp. 236-247. DOI: 10.1080/00913367.2017.1297273.
Meiselman, H.L. (2008) Experiencing food products within a physical and social context, in H.N.J. Schifferstein and P. Hekkert (Eds.), Product experience, Oxford, UK: Elsevier, pp. 559-580.
Messe Berlin GmbH (2021) Fruit Logistica's annual European Statistics Handbook 2021. Retrieved from https://www.fruitlogistica.com/fruit-logistica/downloads-alle-sprachen/auf-einen-blick/european_statistics_handbook_2021.pdf (accessed 3 may 2021).
Mishra, M. (2021) Customer Experience: Extracting Topics From Tweets. International Journal of Market Research, Vol. 64, Nº 3, pp. 334-353. DOI: 10.1177/14707853211047515.
Moreno-Sandoval L.G., Sánchez-Barriga C., Buitrago, K.E., Pomares-Quimbaya A. and Garcia J.C. (2018) Spanish Twitter Data Used as a Source of Information About Consumer Food Choice. En: Holzinger A., Kieseberg P., Tjoa A., Weippl E. (Eds.). Machine Learning and Knowledge Extraction. CD-MAKE 2018. Lecture Notes in Computer Science. Cham: Springer, Cham, p. 11015.
Mostafa, M.M. (2019) Clustering halal food consumers: A Twitter sentiment analysis. International Journal of Market Research, Vol. 61, Nº 3, pp. 320-337. DOI: 10.1177/1470785318771451.
Nobre, H. and Silva, D. (2014) Social network marketing strategy and SME strategy benefits. Journal of Transnational Management, Vol. 19, Nº 2, pp. 138-151. DOI: 10.1080/15475778.2014.904658.
Pew Research Center (2019) Use of smartphones and social media is common across most emerging economies. Available at: https://www.pewresearch.org/internet/2019/03/07/use-of-smartphones-and-social-media-is-common-across-most-emerging-economies/ (accessed 27 April 2022).
R Core Team (2018). R: A language and environment for statistical computing. R Foundation for Statistical Computing, Vienna, Austria. Available at: https://www.R-project.org/ (accessed 25 April 2022).
Recuero-Virto, N. and Valilla-Arróspide, C. (2022) Forecasting the next revolution: food technology’s impact on consumers' acceptance and satisfaction. British Food Journal, Vol. ahead-of-print Nº ahead-of-print. DOI: 10.1108/BFJ-07-2021-0803.
Roggeveen, A. L. and Grewal, D. (2016) Engaging customers: The wheel of social media engagement. Journal of Consumer Marketing, Vol. 33, Nº 2. DOI: 10.1108/JCM-12-2015-1649.
Ruggeri, A. and Samoggia, A. (2018) Twitter communication of agri‐food chain actors on palm oil environmental, socio‐economic, and health sustainability. Journal of Consumer Behaviour, Vol. 17, Nº 1, pp. 75-93. DOI: 10.1002/cb.1699.
Samoggia, A., Riedel, B. and Ruggeri, A. (2020) Social media exploration for understanding food product attributes perception: the case of coffee and health with Twitter data. British Food Journal, Vol. 122, Nº 12, pp. 3815-3835. DOI: 10.1108/BFJ-03-2019-0172.
Samoggia, A., Bertazzoli, A. and Ruggeri, A. (2019) Food retailing marketing management: social media communication for healthy food. International Journal of Retail and Distribution Management, Vol. 47, Nº 9, pp. 928-956, DOI: 10.1108/IJRDM-08-2018-0178.
Sashittal, H. and Jassawalla, A. (2019) Brand entification as a post-anthropomorphic attribution among twitter-using millennials. Marketing Intelligence and Planning, Vol. 37, Nº 2, pp. 741-753. DOI: 10.1108/MIP-10-2018-0446.
Singha, A., Shuklab, N. and Mishrac N. (2018) Social media data analytics to improve supply chain management in food industries. Transportation Research Part E. Logistics and Transportation Review, Vol. 114, pp. 398-415, DOI: 10.1016/j.tre.2017.05.008.
Sivarajah, U., Kamal, M. M., Irani, Z. and Weerakkody, V. (2017) Critical analysis of big data challenges and analytical methods. Journal of Business Research, Vol. 70, pp. 263-286. DOI: 10.1016/j.jbusres.2016.08.001.
Smith, A. N., Fischer, E. and Yongjian, C. (2012) How does brand-related user-generated content differ across YouTube, Facebook, and Twitter. Journal of Interactive Marketing, Vol. 26, Nº 2, pp. 102-113. DOI: 10.1016/j.intmar.2012.01.002.
Statista (2022). Global social networks ranked by number of users 2020. Retrieved from https://www.statista.com/statistics/272014/global-social-networks-ranked-by-number-of-users/ (accessed 3 May 2022).
Tao, D., Yang, P. and Feng, H. (2020) Utilization of text mining as a big data analysis tool for food science and nutrition. Comprehensive Reviews in Food Science and Food Safety, Vol. 19, pp. 875-894. DOI: 10.1111/1541-4337.12540.
Taueja, S. and Toombs, L. (2014) Putting a face on small businesses: Visibility, viability, and sustainability the impact of social media on small business marketing. Academy of Marketing Studies Journal, Vol. 18, Nº 1, 249-260.
Twitter, 2022 Timelines. Extracted from https://developer.twitter.com/en/docs/twitter-api/tweets/timelines/introduction (accessed 3 May 2022).
Vidal, L., Ares, G., Machín, L. and Jaeger, S.R. (2015) Using Twitter data for food-related consumer research: A case study on ‘‘what people say when tweeting about different eating situations. Food Quality and Preference, Vol. 45, pp. 58-69. DOI: 10.1016/j.foodqual.2015.05.006.
Yanai, K. and Kawano, Y. (2014) Twitter Food Photo Mining and Analysis for One Hundred Kinds of Foods. In: Advances in Multimedia Information Processing – PCM 2014: 15th Pacific-Rim Conference on Multimedia, Kuching, Malaysia, December 1-4, pp.22-32.
Zachlod, C., Samuel, O., Ochsner, A. and Werthmüller, S. (2022). Analytics of social media data – State of characteristics and application. Journal of Business Research, Vol. 144, pp. 1064-1076. DOI: 10.1016/j.busres.2022.02.16.
Zanini, M., Lima, V., Migueles, C., Reis, I., Carbone, D. and Lourenco, C. (2019) Soccer and twitter: virtual brand community engagement practices. Marketing Intelligence and Planning, Vol. 37, Nº 7, pp. 791-805. DOI: 10.1108/MIP-08-2018-0371.
Zuo, M. Z., Angelopoulos, S. A., Ou, C. X., Carol, X. C., Liu, H. L. and Liang, Z. L. (2020) Optimizing product offerings to enhance competitive sector on online marketplaces (April 22, 2020). SSRN. DOI: 10.2139/ssrn.3598889.